如何在 React 中使用图表库,如 VChart?
问题描述
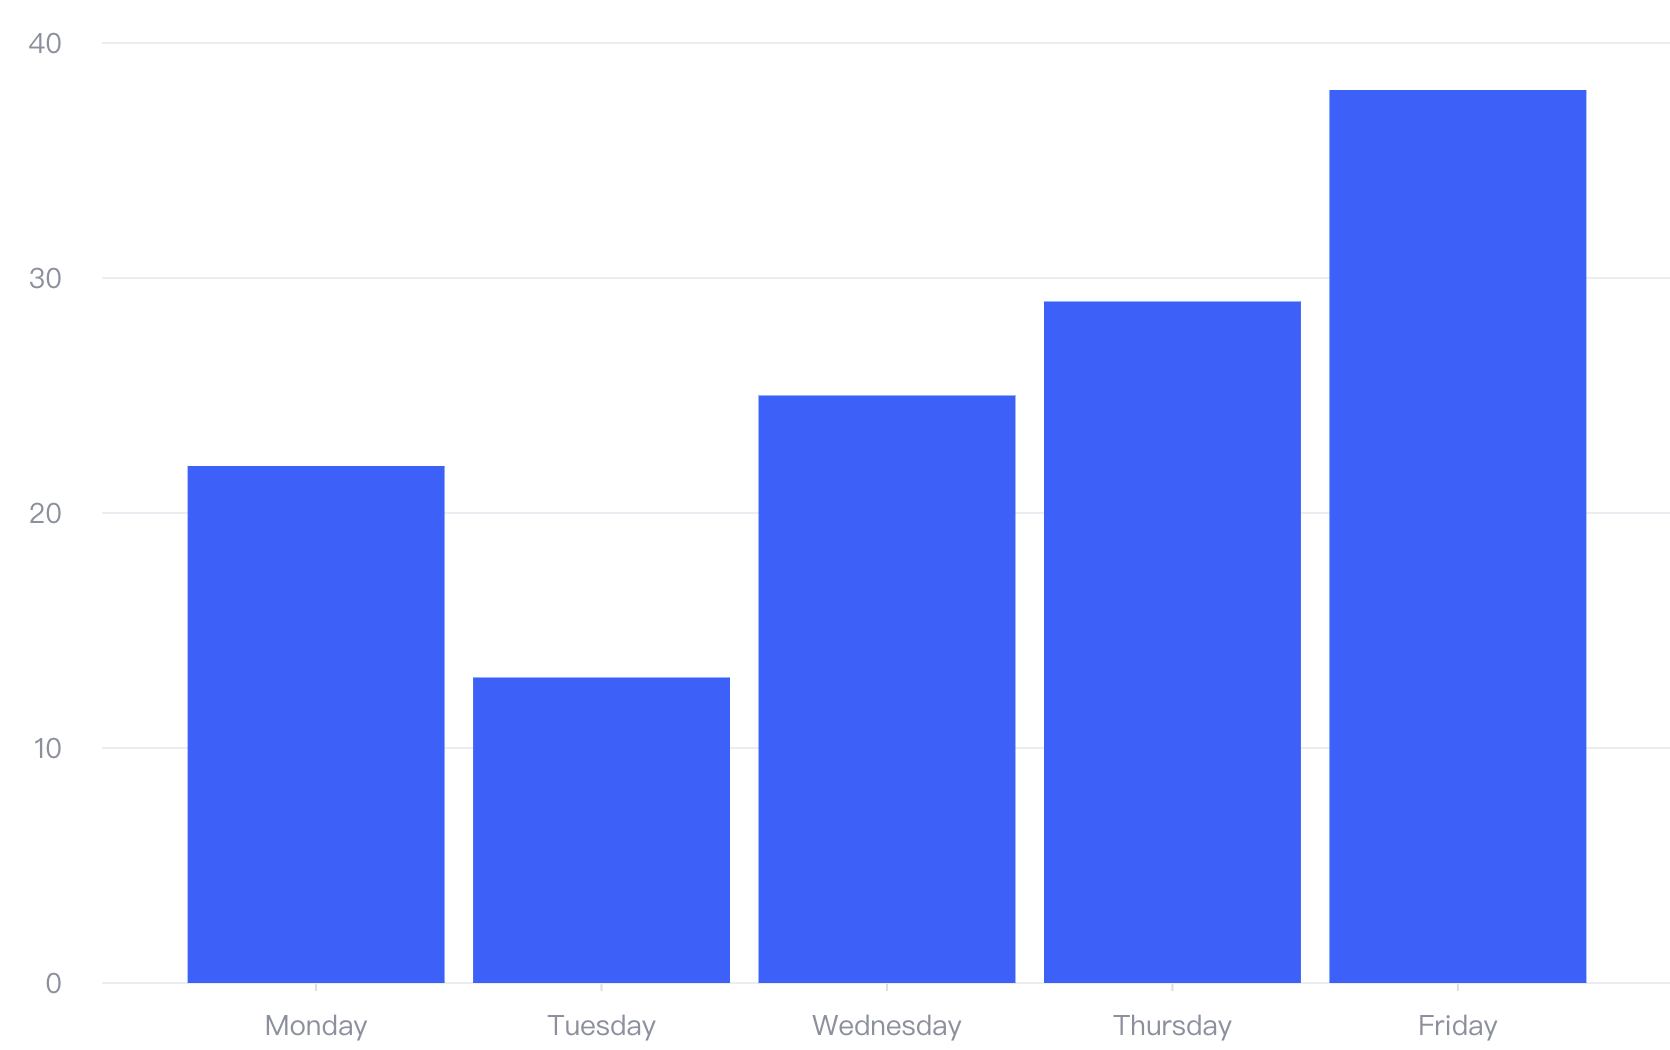
如何在 React 中实现这样的柱状图
有什么需要注意的点吗?
解决方案
在 React 中使用 VChart 有多种方案:
- 通过 VChart 官方提供的 React 封装库
react-vchart实现,教程可参考 - 自己在 React 中基于 VChart 封装
代码示例
/* @refresh reset */
import { VChart, VChartProps } from "@visactor/react-vchart";
import { useMemo } from "react";

export interface AreaChartProps {
  colors?: string[];
}

export const AreaChart = (props: AreaChartProps) => {
  const { colors } = props;

  const spec = useMemo(() => {
    const areaColors = colors ?? [
      "#6690F2",
      "#70D6A3",
      "#B4E6E2",
      "#63B5FC",
      "#FF8F62",
      "#FFDC83",
      "#BCC5FD",
      "#A29BFE",
      "#63C4C7",
      "#F68484"
    ];
    return {
      type: "area",
      data: {
        values: [
          { type: "Nail polish", country: "Africa", value: 4229 },
          { type: "Nail polish", country: "EU", value: 4376 },
          { type: "Nail polish", country: "China", value: 3054 },
          { type: "Nail polish", country: "USA", value: 12814 },
          { type: "Eyebrow pencil", country: "Africa", value: 3932 },
          { type: "Eyebrow pencil", country: "EU", value: 3987 },
          { type: "Eyebrow pencil", country: "China", value: 5067 },
          { type: "Eyebrow pencil", country: "USA", value: 13012 },
          { type: "Rouge", country: "Africa", value: 5221 },
          { type: "Rouge", country: "EU", value: 3574 },
          { type: "Rouge", country: "China", value: 7004 },
          { type: "Rouge", country: "USA", value: 11624 },
          { type: "Lipstick", country: "Africa", value: 9256 },
          { type: "Lipstick", country: "EU", value: 4376 },
          { type: "Lipstick", country: "China", value: 9054 },
          { type: "Lipstick", country: "USA", value: 8814 },
          { type: "Eyeshadows", country: "Africa", value: 3308 },
          { type: "Eyeshadows", country: "EU", value: 4572 },
          { type: "Eyeshadows", country: "China", value: 12043 },
          { type: "Eyeshadows", country: "USA", value: 12998 },
          { type: "Eyeliner", country: "Africa", value: 5432 },
          { type: "Eyeliner", country: "EU", value: 3417 },
          { type: "Eyeliner", country: "China", value: 15067 },
          { type: "Eyeliner", country: "USA", value: 12321 },
          { type: "Foundation", country: "Africa", value: 13701 },
          { type: "Foundation", country: "EU", value: 5231 },
          { type: "Foundation", country: "China", value: 10119 },
          { type: "Foundation", country: "USA", value: 10342 },
          { type: "Lip gloss", country: "Africa", value: 4008 },
          { type: "Lip gloss", country: "EU", value: 4572 },
          { type: "Lip gloss", country: "China", value: 12043 },
          { type: "Lip gloss", country: "USA", value: 22998 },
          { type: "Mascara", country: "Africa", value: 18712 },
          { type: "Mascara", country: "EU", value: 6134 },
          { type: "Mascara", country: "China", value: 10419 },
          { type: "Mascara", country: "USA", value: 11261 }
        ]
      },
      color: {
        type: "ordinal",
        domain: [],
        range: areaColors
      },
      title: {
        visible: true,
        text: "Stacked line chart"
      },
      stack: true,
      xField: "type",
      yField: "value",
      seriesField: "country",
      legends: [{ visible: true, position: "middle", orient: "bottom" }]
    } as VChartProps["spec"];
  }, [colors]);

  return <VChart spec={spec} />;
};
结果展示